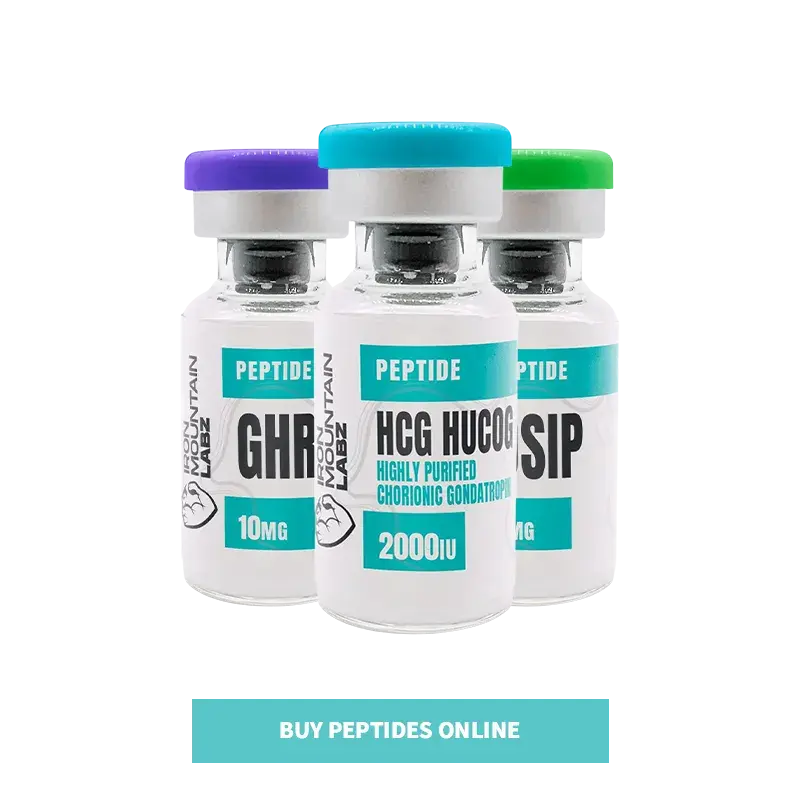
Peptides are investigational compounds that are studied for their role in muscle repair, metabolism, and cell signaling. However, to get useful research results, it’s important to use the right amount. (r)
In this blog, you’ll get guidelines on a dosage chart based on research practices to let researchers plan their experiments more accurately. First, let’s have an overview of peptides.
Peptides are short chains made of amino acids that are connected together through peptide bonds. Most peptides have between two and fifty amino acids. This makes them shorter than proteins.
Peptides are easy to synthesize in the laboratory, but questions like are peptides legal often come up in discussions around their use in research. They are made using a method called solid-phase peptide synthesis (SPPS). This allows them to build specific sequences for their experiments.
Peptides are used in many research areas. These include cell signaling, immune system studies, testing new treatments, and drug delivery research.
Accurate doses are important in peptide research. A very high or too low dose of a peptide can change how it behaves in test subjects. This may lead to results that don’t match across studies.
When doses are administered accurately, it becomes easier for experts to study how changes in dose may affect results. It can lower the chance of errors and ensure that the effects come from the peptide itself, not from how it was handled.
There are several key factors that can affect what amount of peptide that should be used in a research setting. For example:
The size and shape of a peptide can affect how it works in test models. This means peptides with a larger size and higher molecular weight may need different doses than those with a smaller molecular weight.
Method of administration, such as by injection, nasal spray, or oral delivery, can also change how much dose is required for the chosen subject. Some methods result in faster breakdown, which requires higher doses to maintain consistent levels.
Some peptides break down faster when they are reconstituted or introduced to experimental environments. Peptides with a short half-life may need to be dosed more often. Similarly, more stable peptides can last longer with fewer applications.
Different species, cell cultures, or research systems respond differently to the same peptide. For example, peptides that work in a rodent model may not apply to an in vitro study. So, the dosage needs to be adjusted based on the type of model being used.
The Impurities in peptides can affect how they work. A high-purity peptide and the correct solvent ensure that dosing calculations are accurate and consistent.
Peptides are used in research for different purposes such as tissue repair, metabolism studies, and hormone signaling. Its dosage depends on the peptide’s structure, stability, and study goals.
Note: All doses in tables below are approximate and given in micrograms (μg) or milligrams (mg) per kilogram (kg) of body weight, as typically used in animal studies.
| Peptides | Research Dosage Range | Frequency of Use in Research |
| GHRP-2 / GHRP-6 | 100–300 μg/kg | 1–2 times daily |
| Ipamorelin | 100–200 μg/kg | 1–2 times daily |
| CJC-1295 (with DAC) | 100–300 μg/kg | Once every few days |
| Peptides | Research Dosage Range | Frequency of Use in Research |
| IGF-1 LR3 | 20–100 μg/kg | Once daily |
| BPC-157 | 200–500 μg/kg | Divided across dosing sites |
| TB-500 (Thymosin Beta-4) | 2–5 mg | Once a week, and often split into two doses |
| Peptides | Research Dosage Range | Frequency of Use in Research |
| AOD-9604 | 200–500 μg/kg | Once daily |
| Tesamorelin | 100–200 μg/kg | Once daily |
| MOTS-c | 5–15 mg/kg | Administered over multiple days in studies |
| Peptides | Research Dosage Range | Frequency of Use in Research |
| Semax | 300–600 μg/kg | 1–2 times daily |
| Selank | 250–500 μg/kg | 1–2 times daily |
| Dihexa | Not standardized | Once daily or as per study protocol |
A peptide dosage chart helps you measure the right amount of peptide after mixing it with water. Here’s how to use it step by step:
You’ll see terms like mcg (micrograms), IU (international units), and ml or cc (milliliters). The chart helps you turn those into syringe units so you can easily measure your dose.
Most charts work with a 1ml insulin syringe. These syringes have numbers from 0 to 100. If the chart says “10 units = 250mcg,” just pull the plunger to 10 to get that dose.
The numbers change based on how much water you added to your peptide. So, if you add 1ml of water, the dose per unit would be different than if you used 2ml. Here, it is important to use the right dosage chart for the amount of water you mix into your peptide.
Once you mix your peptide with a certain amount of water, stick with it. Changing it later can confuse your dosing.
If the chart is hard to read, you can use a peptide mixing calculator online. Just type in how much peptide and water you used, and it will tell you how many units to take.
When you mix your peptide with bacteriostatic water, store it in the refrigerator at 36°F to 46°F, follow best practices on how to store peptides? Do not freeze it unless the instructions say so. Keep the vial sealed, clean, and away from light and heat to prevent breakdown.
You need to inspect the liquid for color changes, cloudiness, or particles before use. If it looks unusual, don’t use it. Most peptides stay stable for 2 weeks to a month after mixing.
In conclusion, the right dose of a peptide is important for reliable research results, and understanding the differences in SARMs vs peptides can also help researchers choose the right compound for their studies. This guide shows how the delivery method, type of peptide, and test model can affect dosing. Peptide dosing charts can help researchers measure doses correctly. Similarly, being consistent with dosing improves lab work and makes it easier to compare results.
Reconstituted peptides stay stable for 2 weeks to a month after mixing with bacteriostatic water, as long as they are kept in the fridge between 36°F and 46°F.
Use a clean syringe (needle & syringe safety guide) to slowly add bacteriostatic water down the side of the vial. Let the powder dissolve on its own and don’t shake it. You may need to swirl the vial if needed. This keeps the peptide from breaking down and helps you get the correct amount in each dose.
You can use many online peptide calculators. They’re simple to use. You need to enter how much peptide you have and how much water you added, and it tells you how many units to pull in your syringe for the dose you want.
If the liquid changes color, becomes cloudy, or has particles floating in it, the peptide may no longer be good. Also, if it smells strange or was stored outside the fridge for too long, it’s safer not to use it.